This article is to provide an overview of PromisePoint reports that are available for PromisePoint learning and Classroom activity.
How to Access PromisePoint Reports
After logging into PromisePoint, click on the graph menu icon to access the reports page.

- Depending on the PromisePoint user role, the type of PromisePoint reports available are:
Course Completion reports display simulation or online course completion data for active users.
(ILT) Classroom reports display enrollment and attendance information for classroom learning for Instructor Led Training.
Practicum reports display task level tracking information.
Administration reports specific to administrative duties, such as managing the content accessible in PromisePoint.
Learner displays learner's transcript.
Course Completion Reports
Course completion reports are designed to display PromisePoint learners curriculum activity.
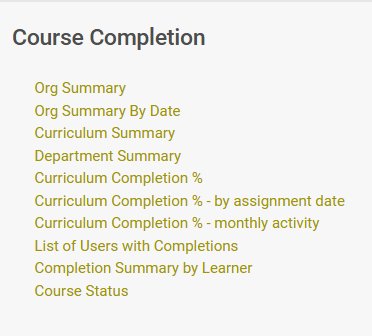
The screenshot below is an example of Course Completion reports available in PromisePoint:
User Lookup
The User Lookup is a course completion report created for report admins to search for a learner’s profile easily, and the data listed can be used as an aid for data selection when running other reports. For instance, if a learner is not showing up on a report, the user lookup will show if they have an active PromisePoint username.
How to run it
First, click on the User Lookup button, or the link in the course completion list.
Second, begin keying in the PromisePoint user name or last/first name to access a directory.
Then, find and select the user.
Fourth, once the selection is made the user profile will display with a choice to either Clear Results or View User Report.
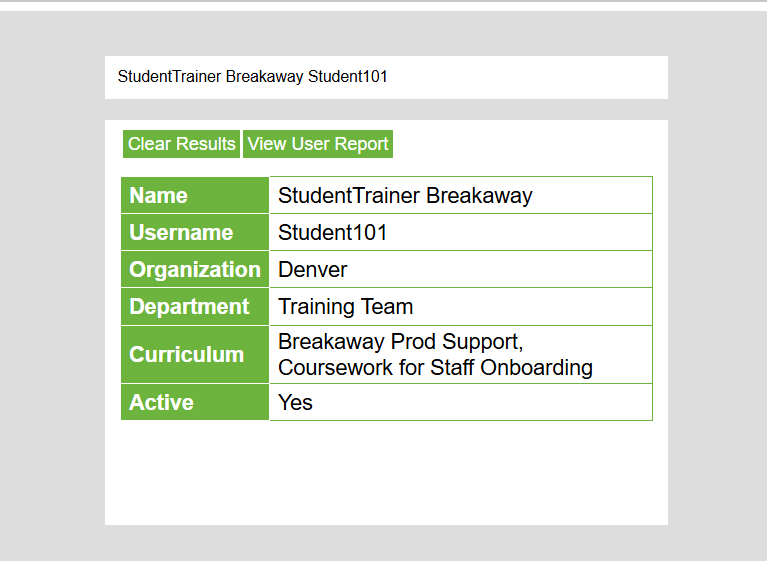
Clearing the results, will remove the profile to begin another search, and viewing user report, will display the leaner’s transcript.
Org Summary and Org Summary by Date
The Org Summary reports are reports displays all curriculum data for active learners based on their locations and departments, beginning at the organizational level. This report has a drill down feature that will display the location and then department level activity, as well as a learner's transcript.
Org Summary
The Org Summary report displays rolled up results of all curriculum data for active learners based on their locations and departments. This report allows you to drill down to department level learners and individual transcripts.
How to run it
First, click on the Org Summary link.
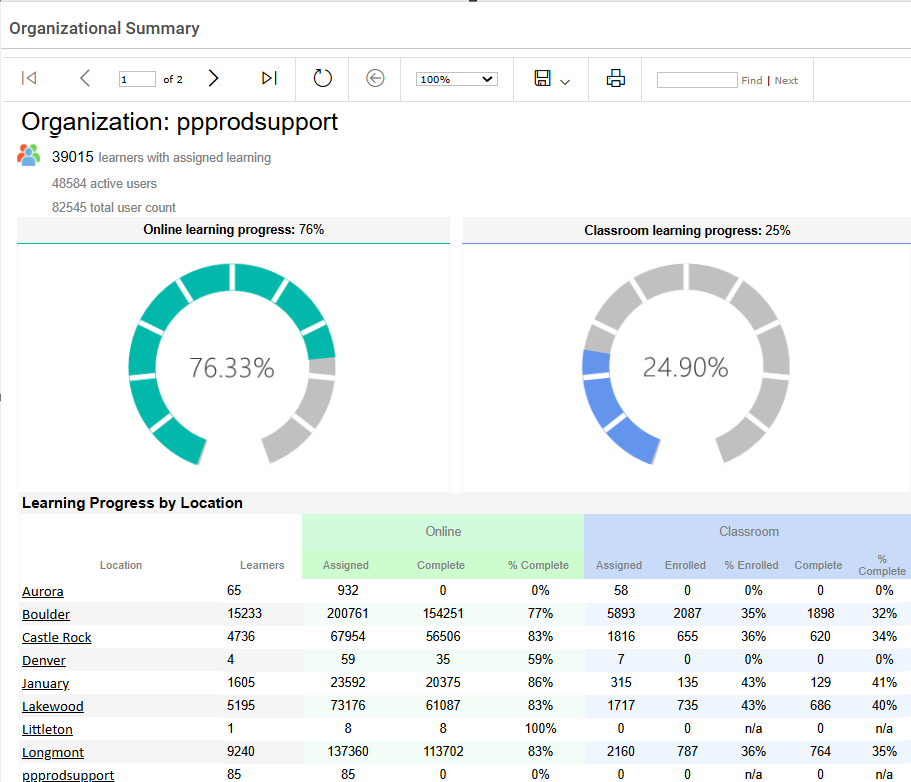
Second, the report opens and displays.
The top portion of the Org Summary displays two graphs based on the total learners and their assignments up to the current date. One graph displays the completion percentage for online learning or SIMs and the second graph displays the attendance for the classroom learning.
Org Summary by Date (also known as Snapshot)
The Org Summary by Date displays only online learning or SIMs completion data, but can be filtered for a specific date period.
How to run it
First, click on the Org Summary By Date link.
Second, choose your reporting period, using the data selection, start date and end date.
The report will display data starting at the start date keyed in. The start date is based on when the curriculum was assigned and the end date is based on when the course was completed or for classroom activity when the learner attended the event.
Like Organizational Summary, the report begins at the organizational level, then can be drilled down to the location, department levels and individual learners' transcripts.
Curriculum Summary
The curriculum summary report is a report that displays a curriculum’s progress within a date range based on the date between the assigned curriculum date and completion date of the assignments.
How to run it
First, click on the Curriculum Summary link
Second, the report opens with a data selection header displayed. Begin by selecting the first value in the first field, fields may be based on the previous value.
Third, select a range of curriculum assignment dates.
Fourth, select the range of course completion dates.
Fifth, select yes to run the report for all curricula or select no to select specific curriculums.
Sixth, check the boxes of the specific curriculum to run the report if selected no.
Seventh, click, “View Report” once all selections have been made.

In this example, the report shows all curriculums that have courses and classes assigned from the dates selected.
The top portion of the report displays the overall total amounts of the curriculums assigned to learners with the total locations and their departments. On the second line, the report breaks down online course completion results and ILT Session Attendance.
The lower portion of the report allows you to click the curriculum link to drill down to a department list report based on the curriculum, and from there the department link will drill down to the learners assigned to the curriculum. From the department list drill down to the leaners assigned to the curriculum in the specific department.
Department Summary
The Department Summary report displays learner progress within a date range, based on a department.
How to run it
First, click on the Department Summary link
Second, the report opens with a data selection header displayed. Begin by selecting the first value in the first field, fields may be based on the previous value.
Third, select the range of course assignment dates.
Fourth, Select the range of course completion dates.
Fifth, select yes to run the report for all locations or select no to select specific location.
Sixth, check the boxes of the specific department to run the report if selected no.
Seventh, click, “View Report,” once all selections have been made.

In this example, the report shows all curriculums that have courses and classes assigned from the dates selected.
The top portion of the report displays the overall total amounts of learners with the total locations and their departments. On the second line, the report breaks down the totals between the online course completion results and ILT Session Attendance.
Click the department link to drill down to the leaners assigned to the curriculum in the specific department.
Curriculum Completion%
The Curriculum Completion% report lists learners by locations and departments and their overall progress toward completing a curriculum within a date range.
How to run it
First, select your start date as the date the curriculum was assigned and end date, when the assignment of the curriculum was (if) completed.
Second, select your Location. Here you can choose Select All or check the boxes of the locations you want.
Third, select your departments which will be based on the location/s selected. Note: it is best practice to select specific departments when running this report.
Fourth, select Yes all curriculums or no.
If you select no the next data selection, will have an "all" (for all curriculums) box, otherwise choose the curriculums for the report will display.
Next, choose the status of the curriculum's assignments to display. In this example take the default of 100% Complete.
Lastly, click, “View Report,” once all selections have been made.

In this example, the locations, departments and curriculums selected display with the columns associated to the progress of each learners assignments activity.
Also, each learner displays a link that can drill down to their transcript.
Course Status
The Course Status report displays the status of the course assigned to learners based on location and department.
How to run it
First, click on the Course Status link
Second, the report opens with a data selection header displayed. Begin by selecting the first value in the first field, fields may be based on the previous value.
Third, click on the scroll arrow to check the box for each location needed.
Fourth, then, click on the scroll arrow to check the box for each department needed.
Fifth, then, click the scroll arrow to select the course.
Sixth, check the box of each status needed.
Seventh, click, “View Report” once all selections have been made.

The top portion of the report displays the title of the course, the assigned learners, and the total completion status of learner activity, highlighted in pink, gold and green.
The report lists assigned learners with the course status. It also shows the date and grade if completed and the length of time it took to complete.
 NOTE: There are 4 levels of access for reports, however some organizations may limit the number of levels used.
Admin level - A report admin with admin level has access to all reports at all levels
Executive level - A report admin with executive level has access to Admin Reports at their location level.
Department level - A report admin at department level can only run Department reports at their department level.
Learner level - all PromisePoint learners can view their transcripts.